Business Booms
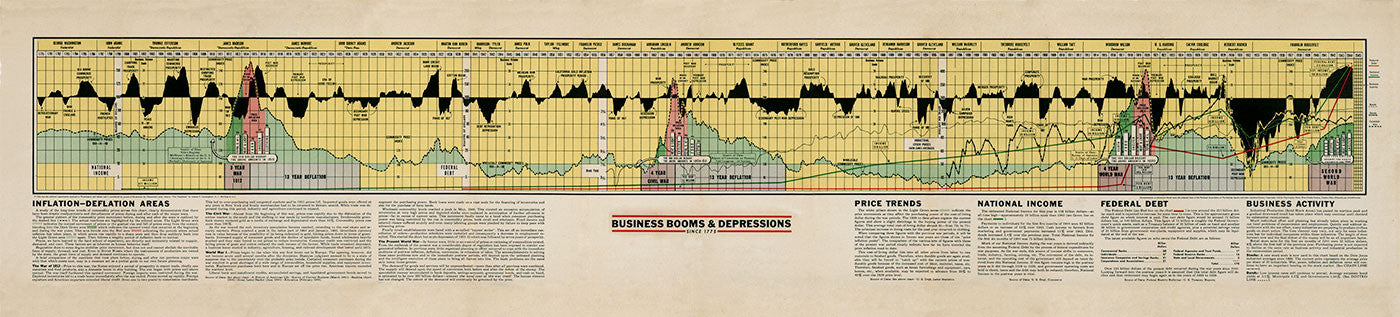
A restored 1945 financial history chart mapping U.S. business booms, depressions, inflation, deflation, debt, income, prices, and prosperity from 1775 to 1944.
Size:
49 x 11
Business Booms
If you have any questions, you are always welcome to contact us. We'll get back to you as soon as possible, within 24 hours on weekdays.
-
Shipping Information
Use this text to answer questions in as much detail as possible for your customers.
-
Customer Support
Use this text to answer questions in as much detail as possible for your customers.
-
FAQ’s
Use this text to answer questions in as much detail as possible for your customers.
-
Contact Us
Use this text to answer questions in as much detail as possible for your customers.
Business Booms
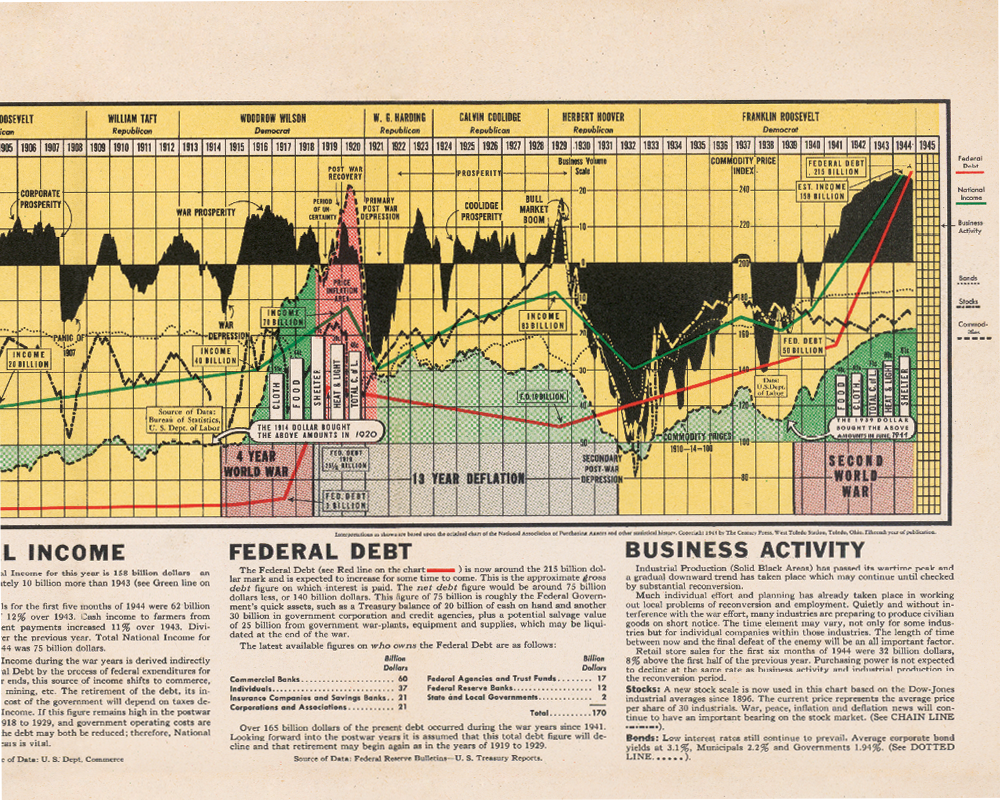
Business Booms and Depressions Since 1775 is a restored financial history chart of the United States, originally created in 1945. The chart covers the period from 1775 to 1944 and brings together inflation and deflation, price trends, national income, federal debt, business activity, and presidential administrations.
At the center is a large wave form showing the rise and fall of national prosperity over time. The surrounding data layers make it possible to trace periods of expansion, recession, crisis, recovery, and long-term economic change across American history.
This reproduction was made from a professional, high-resolution scan of the original chart and carefully restored by hand.
PAPER & PRINTING
Printed on archival-grade, acid-free matte fine-art paper with a natural surface for crisp detail, accurate color, and lasting display quality.